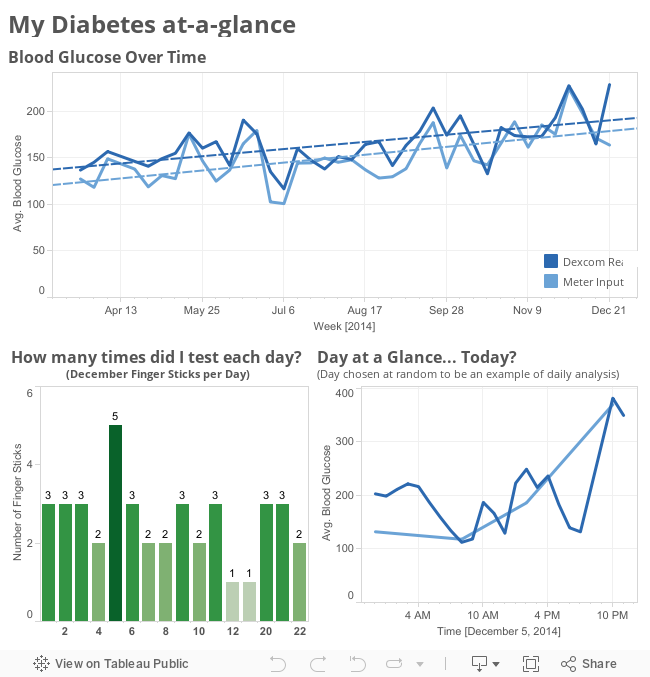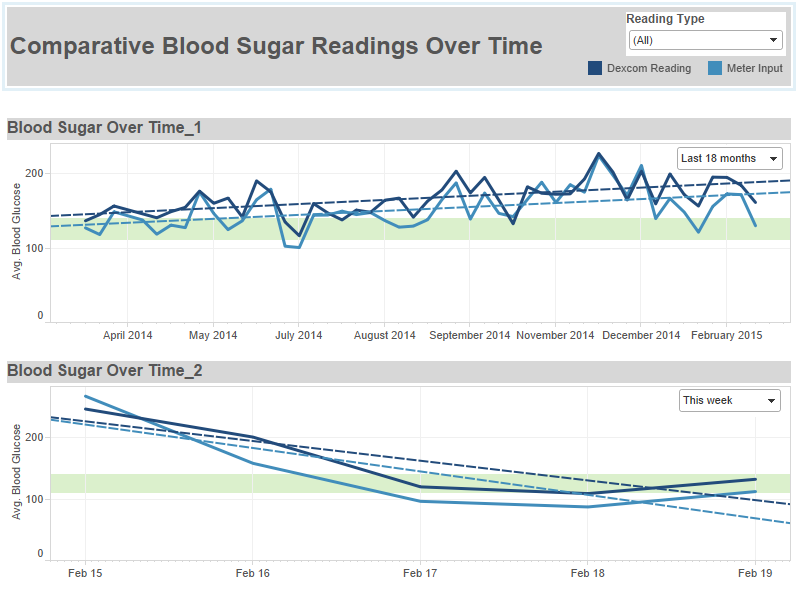
Creating dashboards to answer questions — my question is how am I doing now, as opposed to then? and I want to be able to change both of those time frames… comparing this week to last year, this week to last week, this month to last month, to the last three months… and so I created this dashboard. Above is just an image, I’ve started using a bit more technical solutions, so I’m going to be posting image files for a bit until I get a better process in place to use the publicly available/postable versions again.
[Data Dork Stuff] I figured out that the export file I was creating was cutting off at 65,536… does that number ring a bell? Yup, that’s right — the export file was .xls and not .xlsx — I can’t believe that I missed that #dorkfail — so this explained why my data was cutting off in December, in order to resolve this issue I had to export the data from the data blending tool into a Tableau Extract rather than and Excel file, since .xlsx isn’t an export option (#softwarefail #upgraderequest). Building visualizations from a Tableau extract requires using Tableau Desktop, rather than Tableau Public — like I said, I’m working on finding a way back onto public with this data, so that the dynamic versions can be shared here… and elsewhere without the need to use the desktop software. [Other tools] Looking at bringing together data from my OmniPod and my Dexcom — I used Diasense to get a sense (womp womp) for what I’m bringing together. I love their idea, and the tool — but I hate the interface. Okay, hate is a strong word (and I did just say I love the tool <3), but I love data, and I know that it can be displayed in a way that not only looks better, but is more conducive to helping diabetics understand their own bodies and support actionable decisions in their/my daily life. Next Steps… OmniPod data…
In other news, I’m really struggling staying on a diabetic diet — I eat breakfast, I snack smart, I get all the way to the evening and then I get a case of the fuck-its, except while still hearing reason in my head… it’s maddening. Hoping look at all this data will help me see what I need to see clearly… and help me to make the right decisions, or at least the right next step.